History
My Market History
Twenty-five years, one table — and the first decade of a career.
I first walked onto a trading desk for my 1st post college full-time job on Tuesday 9/4/01, one week before 9/11/01.
Those were the days of Bloomberg running on dual stack desktops sitting under desks that held multiple monitors, banks of land-lines, 7 fax machines in the little closet to confirm trades, manual/paper ISDAs before IG or HY CDX was born (let alone ABX or CMBX), and the right sweet spot to walk in was b/n 6:30 and 6:40am every day, every_day.
To mark 25 years, below a short tour of many of the markets I’ve traded — invested — risked:
“The dangers of life are infinite, and among them is safety.”
— Johann Wolfgang von Goethe
Evolution of markets across September 4ths,
from 2001 to 2026
| Marker | Sep 2001 | Sep 2026 | Δ |
|---|---|---|---|
| Dow | 9,998 | 53,686 | +437% |
| S&P 500 | 1,133 | 7,748 | +584% |
| Nasdaq | 1,771 | 26,584 | +1,401% |
| FTSE 100 | 5,318 | 10,817 | +103% |
| Nikkei 225 | 10,650 | 64,214 | +503% |
| Gold ($/oz) | 275 | 4,528 | +1,547% |
| WTI ($/bbl) | 27.5 | 91.5 | +233% |
| Corn (¢/bu) | 215 | 512 | +138% |
| Sugar #11 (¢/lb) | 7.7 | 18.3 | +138% |
| US 10Y | 4.92% | 4.77% | −15 bp |
| US 30Y | 5.45% | 5.25% | −20 bp |
| Fed funds | 3.50% | 3.50–3.75% | ~0 bp |
| VIX | 24 | 14.3 | −40% |
| BTC | n/a | 80,974 | n/a |
| BRK.B MktCap | ~$105B | $1.08T | +929% |
| AMZN MktCap | ~$3B | $2.75T | +91,000% |
| NVDA MktCap | ~$10B | $5.42T | +54,000% |
| EUR/USD | 0.89 | 1.17 | +31% |
| GBP/USD | 1.45 | 1.32 | −9% |
| USD/JPY | 119 | 155.5 | +31% |
Approximate levels and market caps, rounded. Fed funds: Greenspan had just cut to 3.50% in Aug 2001; two round trips through zero later, it sits at 3.50–3.75%.
“Don’t tell me what you think, tell me what’s in your portfolio.”
— Nassim Nicholas Taleb
First decade of my career
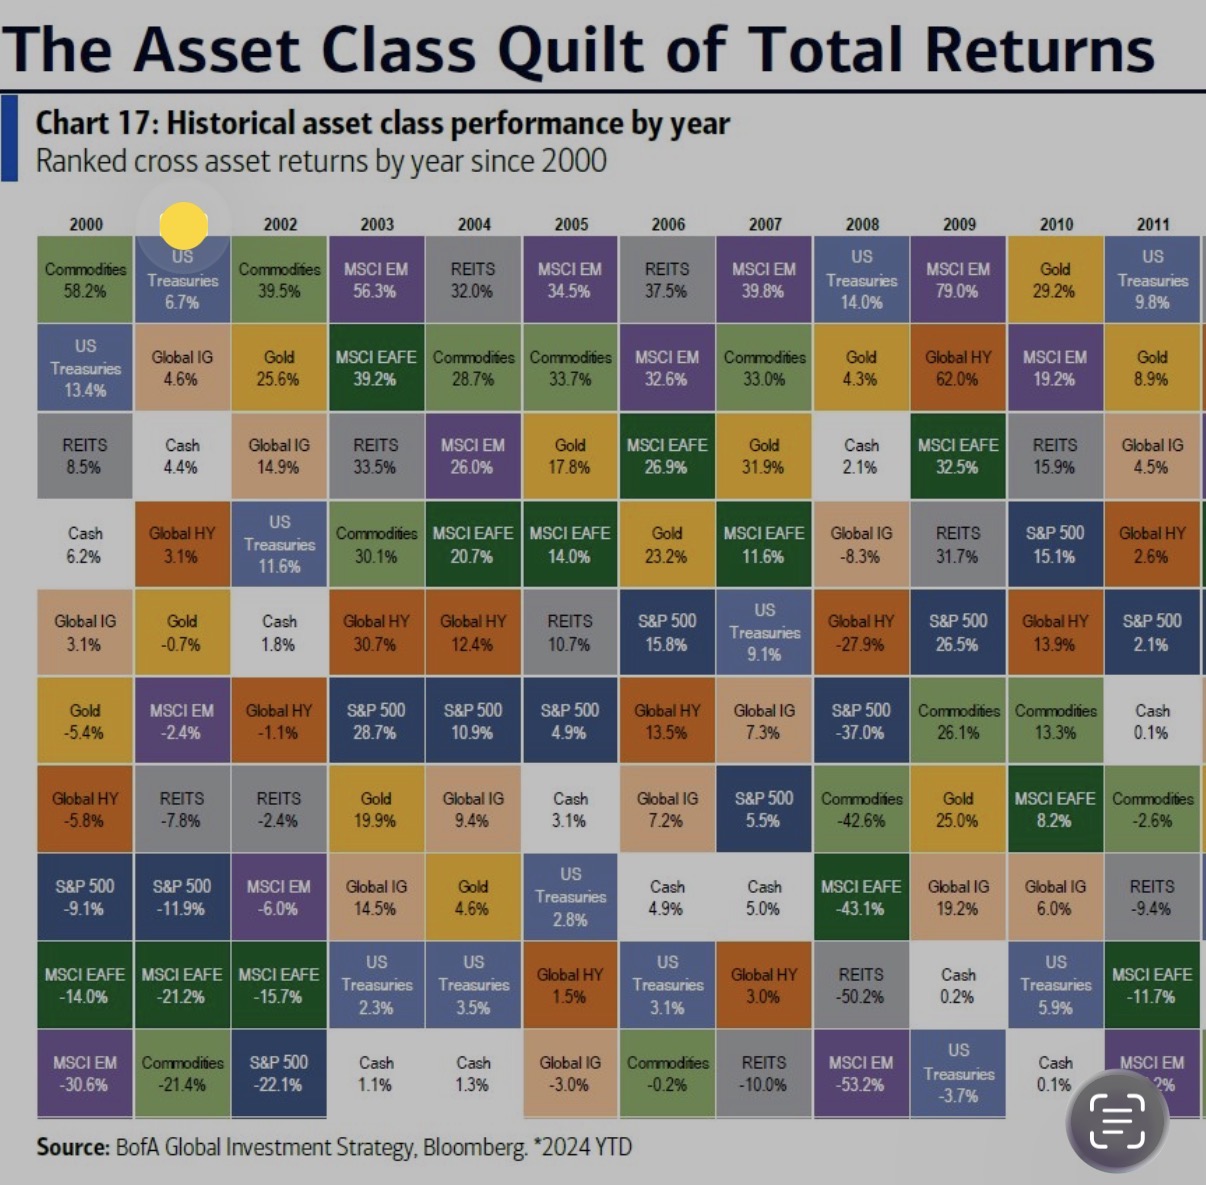
Source: Bank of America Research Institute